Optical Satellite Imagery: What Analysis-Ready Means
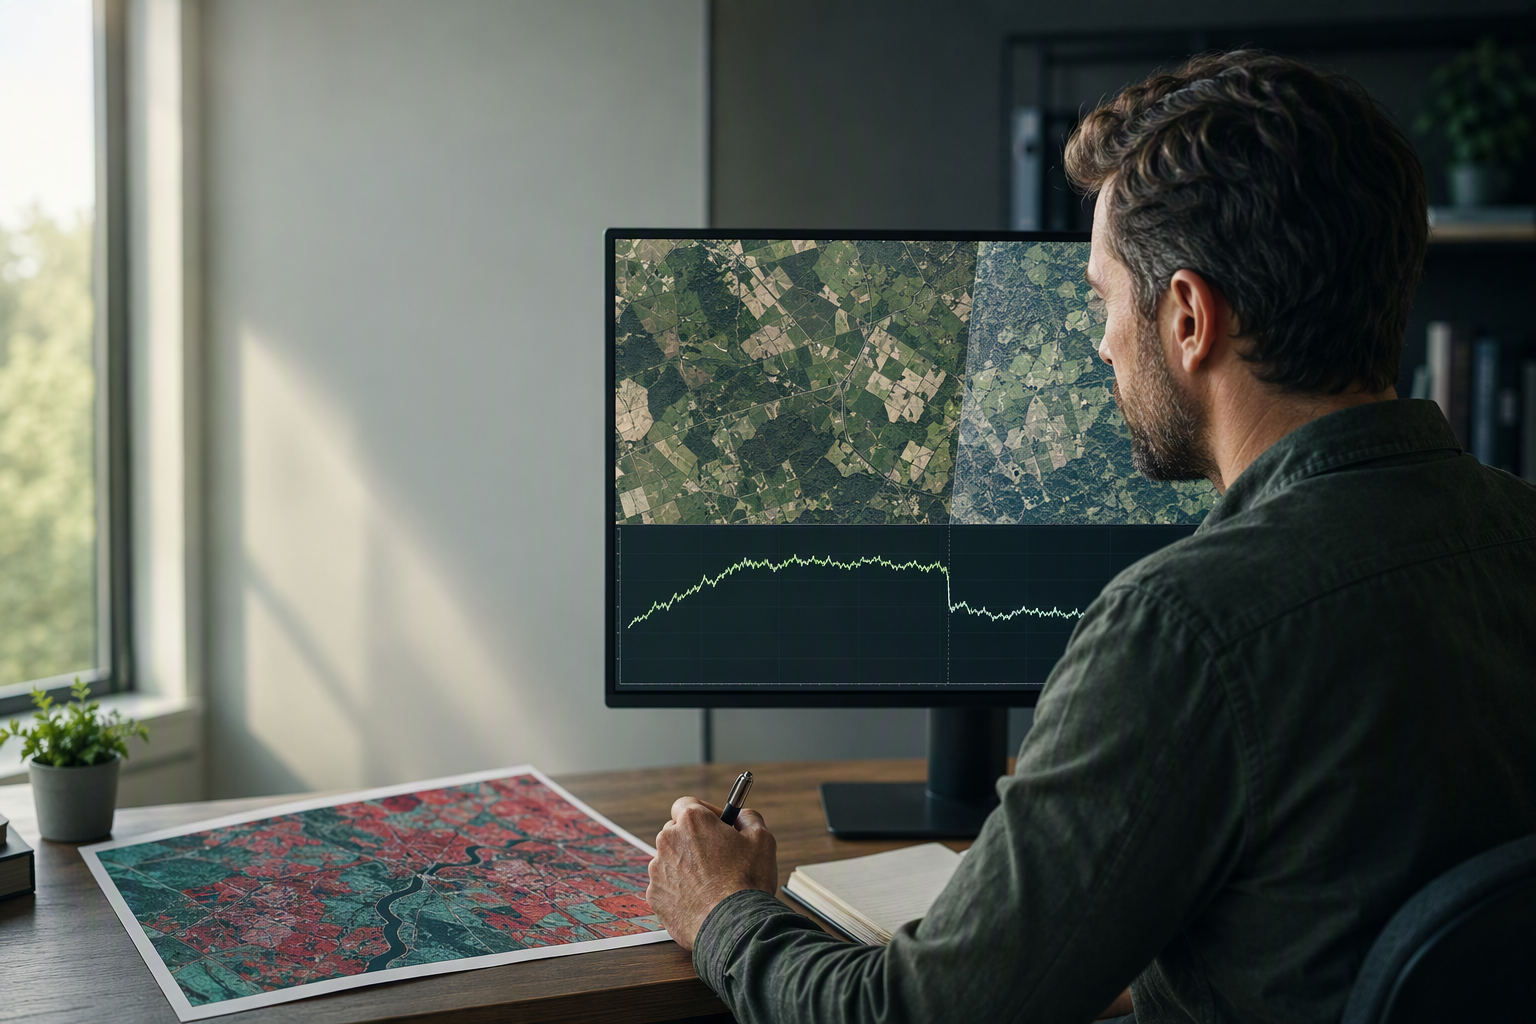
The phrase analysis-ready suggests a product that goes straight into a processing chain. It describes something narrower and more useful than that, and the difference shows up the first time two certified products are stacked into one time series.
What the certification actually requires
The CEOS Analysis Ready Data specifications define threshold and goal requirements for a product family, covering general and per-pixel metadata, radiometric and atmospheric correction, and geometric correction. A product meeting the threshold level has documented geometry, documented corrections, and per-pixel quality information attached.
What threshold conformance does not require is equally specific. It does not mandate normalization for bidirectional reflectance, it does not impose a common cloud masking approach across providers, and it does not guarantee radiometric interoperability between one provider's certified product and another's. Only the first of those is a goal-level requirement that a product may choose to meet. The other two are outside the specification entirely, because it stays algorithm-agnostic by design and leaves the choice of correction and masking to the producer.
For anyone selecting a commercial source, that gap is what matters, and this comparison of the eight best optical providers sets out what each of the optical satellite imagery providers actually delivers, which is the question the certification alone leaves open.
The stacking problem, in concrete terms
Take the two most widely used open products. Landsat Collection 2 and Sentinel-2 Level-2A are both surface reflectance, both well documented, and both handled by every major toolchain. Stacking them into one dense time series is the obvious move for anyone who wants a shorter revisit interval without paying for it.
It is also the move that introduces a systematic step into the signal. Band centers and widths differ between the two sensors, native resolutions differ, and the atmospheric correction algorithms are not the same. The result is a bias that looks like change and is not, appearing at exactly the dates where the series switches from one sensor to the other.
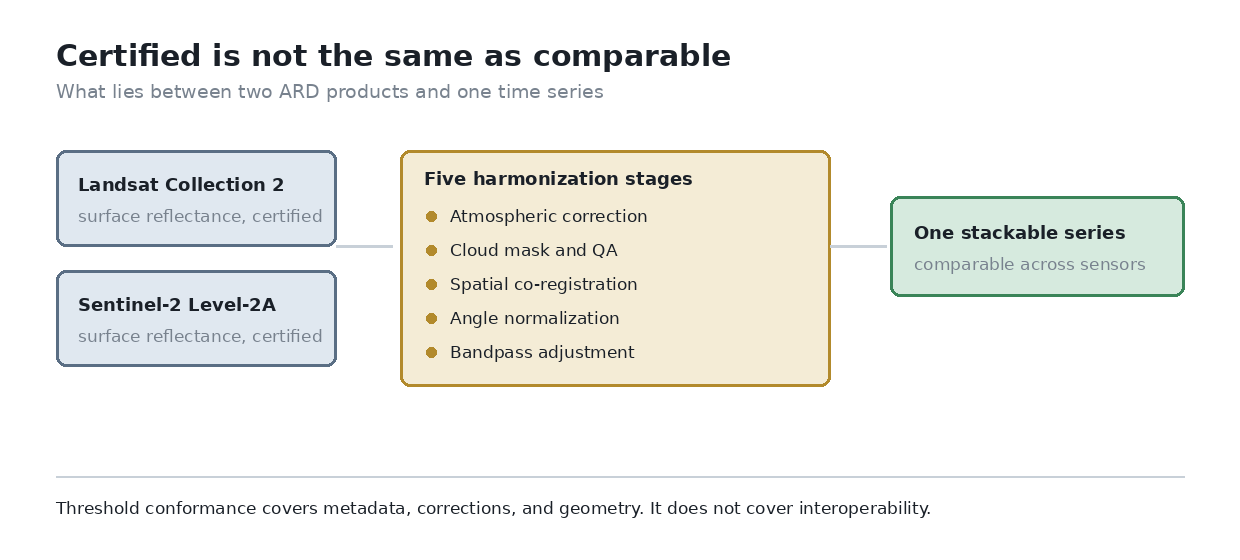
What sits between two certified products and one usable series. Source: own diagram, based on the published HLS processing chain.
The step is small enough to survive review and large enough to change a trend line, which is the worst combination available.
Five steps, not one
The clearest evidence of the size of the problem is a dedicated product built to solve it. The Harmonized Landsat and Sentinel-2 dataset is not a repackaging exercise, and its user guide documents an algorithm chain with five distinct stages.
|
Stage |
What it resolves |
|
Atmospheric correction |
Applies one consistent approach to both input streams |
|
Cloud masking and quality assessment |
Produces one QA convention rather than two |
|
Spatial co-registration |
Removes residual geolocation offsets between sensors |
|
View and illumination angle normalization |
Yields nadir BRDF-adjusted reflectance from varying geometry |
|
Bandpass adjustment |
Maps one sensor's band responses onto the other's |
Five stages is the honest measure of the distance between certified and comparable. A team assembling its own series has to implement or accept each one, and accepting them silently is how a processing artifact ends up in a published figure. None of the five is exotic, and each one requires a deliberate decision that the certification label does not make on the analyst's behalf.
Where this bites in an open toolchain
The failure mode is specific to people who process their own data rather than buying finished analytics. Both inputs are free, both load without complaint, and the raster stack is well formed at every step. Nothing errors.
The discrepancy surfaces at interpretation, when a vegetation index shows a step change at a date with no field event behind it. By then the chain is built, the outputs are cached, and tracing the step backwards costs more than harmonizing would have at the start. Anyone who has worked on the localization builds documented here will recognize the shape of it, because the same class of problem appears whenever two things agree on a format and disagree on everything below it.
· Check whether a product is threshold or goal conformant, since goal level adds BRDF normalization and threshold level does not
· Establish which atmospheric correction produced each input, since the specification names no algorithm and the label hides that choice
· Confirm the cloud mask convention per source, as QA bit meanings differ even between certified products
· Use a purpose-built harmonized product where one exists, rather than reimplementing five stages for a single project
· If harmonizing manually, document every step, because the next analyst inherits the assumptions along with the raster
None of those five is difficult in isolation, and skipping any one puts an artifact into the output that no later step removes.
What to take from it
Analysis-ready is a real and valuable standard. It makes a product self-describing, it makes corrections auditable, and it removes a great deal of the preprocessing that used to consume the first week of any project.
It does not make two products from different sensors into one dataset. That remains a separate task with a separate specification behind it, and recognizing which one applies is the difference between a time series that means something and one that merely runs.